Category Books
- Fiction Books & Literature
- Graphic Novels
- Horror
- Mystery & Crime
- Poetry
- Romance Books
- Science Fiction & Fantasy
- Thrillers
- Westerns
- Ages 0-2
- Ages 3-5
- Ages 6-8
- Ages 9-12
- Teens
- Children's Books
- African Americans
- Antiques & Collectibles
- Art, Architecture & Photography
- Bibles & Bible Studies
- Biography
- Business Books
- Christianity
- Computer Books & Technology Books
- Cookbooks, Food & Wine
- Crafts & Hobbies Books
- Education & Teaching
- Engineering
- Entertainment
- Foreign Languages
- Game Books
- Gay & Lesbian
- Health Books, Diet & Fitness Books
- History
- Home & Garden
- Humor Books
- Judaism & Judaica
- Law
- Medical Books
- New Age & Spirituality
- Nonfiction
- Parenting & Family
- Pets
- Philosophy
- Political Books & Current Events Books
- Psychology & Psychotherapy
- Reference
- Religion Books
- Science & Nature
- Self Improvement
- Sex & Relationships
- Social Sciences
- Sports & Adventure
- Study Guides & Test Prep
- Travel
- True Crime
- Weddings
- Women's Studies
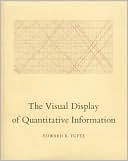
The Visual Display of Quantitative Information » (2nd Edition)

Authors: Edward R. Tufte
ISBN-13: 9780961392147, ISBN-10: 0961392142
Format: Hardcover
Publisher: Graphics Press
Date Published: January 2001
Edition: 2nd Edition
Author Biography: Edward R. Tufte
Edward Tufte is a professor at Yale University, where he teaches courses in statistical evidence and information design. His books include Visual Explanations, Envisioning Information, The Visual Display of Quantitative Information, Political Control of the Economy, Data Analysis for Politics and Policy, and Size and Democracy (with Robert A. Dahl).
He is a fellow of the American Statistical Association, the American Academy of Arts and Sciences, the Guggenheim Foundation, and the Center for Advanced Study in the Behavioral Sciences. He has received honorary doctorates from The Cooper Union and Connecticut College, the Phi Beta Kappa Award in Science, and the Joseph T. Rigo Award for contributions to software documentation from the Association for Computing Machinery.
Book Synopsis
A modern classic. Tufte teaches the fundamentals of graphics, charts, maps and tables. Includes 250 delightfullly entertaining illustrations, all beautifully printed.
Scientific American
Original, beautifully presented, sharp and learned, this book is a work of art. The art here is cognitive art, the graphic display of relations and empirical data, now an indispensable tool of science and engineering.
Table of Contents
- Part I: Graphical Practice
- 1: Graphical Excellence...13
- 2: Graphical Integrity...53
- 3: Sources of Graphical Integrity and Sophistication...79
- 2: Graphical Integrity...53
- Part II: Theory of Data Graphics
- 4: Data-Ink and Graphical Redesign...91
- 5: Chartjunk: Vibrations, Grids, and Ducks...107
- 6: Data-Ink Maximization and Graphical Design...123
- 7: Multifunctioning Graphical Elements...139
- 8: Data Density and Small Multiples...161
- 9: Aesthetics and Technique in Data Graphical Design...177
Epilogue: Designs for the Display of Information...191
- 5: Chartjunk: Vibrations, Grids, and Ducks...107
Subjects
 All Science & Nature
  Mathematics
Nonfiction
 Science & Nature
  Mathematics
Nonfiction
 Science & Nature
  All Science & Nature
